
Introduction
News shapes opinions, influences decisions, and affects how people understand the world. But with so much information online — and so many biased news sources — readers often struggle to identify what’s accurate.
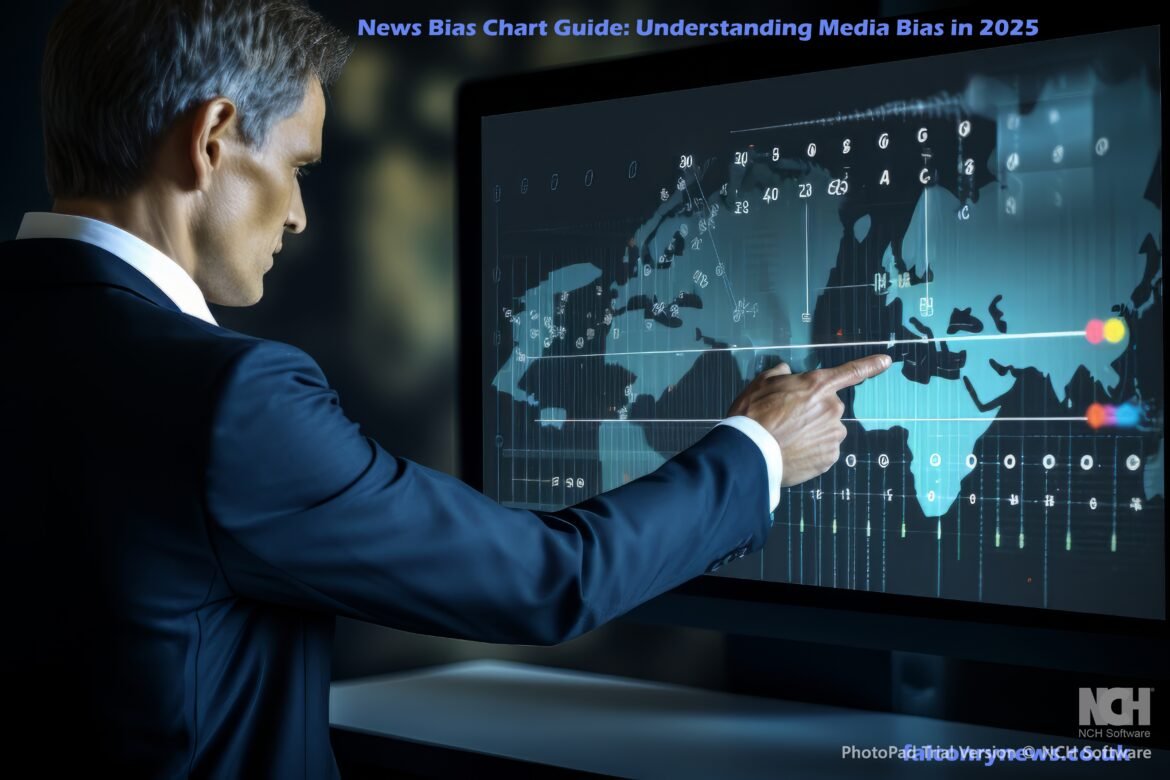
A news bias chart guide helps solve this problem. It visually ranks media outlets based on their political lean, journalistic credibility, and overall reliability score, helping readers separate factual reporting from opinion-driven content.
In this guide, you’ll learn what a news bias chart is, how it’s created, and how to use it to make smarter, more balanced news decisions.
What Is a News Bias Chart?
A news bias chart is a media literacy tool that evaluates news organizations using two factors:
1. Political Bias (Left, Center, Right)
This determines how much an outlet leans toward liberal, centrist, or conservative ideologies.
2. Reliability or Journalistic Quality
This evaluates whether content is:
- factual reporting
- mixed factual/opinion
- heavily editorialized
- misleading or inaccurate
A bias chart helps readers visualize where each outlet sits on the media landscape so they can evaluate information more critically.
Why Media Bias Exists
No news organization is perfectly objective. Many factors influence reporting, including:
- newsroom culture
- editorial decisions
- ownership and funding
- political environment
- target audience expectations
This leads to editorial bias, framing bias, and selection bias, even in high-quality journalism.
Studies show that:
- People often trust news that aligns with their views.
- Social media amplifies partisan stories.
- Younger readers consume more opinion-driven content without realizing it.
These dynamics make media bias detection more important than ever.
How News Bias Charts Are Created
Reputable bias charts use multiple data-driven methods to reduce subjectivity and measure news reliability accurately.
1. Content & Language Analysis
Experts review articles for:
- factual accuracy
- source quality
- evidence-based claims
- emotional or loaded language
- headline framing
- frequency of opinion vs news
2. Political Lean Assessment
Panels of analysts — often from across the political spectrum — evaluate whether coverage supports left-leaning, centrist, or right-leaning narratives.
3. Reliability Ratings & Fact-Checking
Charts cross-reference:
- independent fact-checkers
- journalism watchdog groups
- misinformation trackers
4. Audience Surveys
Readers share how they perceive outlets’ trustworthiness and bias, adding real-world insights.
5. Statistical Scoring Models
Some organizations use algorithms to create a consistent news reliability score across sources.
Types of Bias Shown on a News Bias Chart
Most charts categorize outlets into several ideological and factual tiers.
1. Left-Wing / Liberal Media
Often highlights:
- social justice
- climate action
- progressive policy topics
2. Lean Left Media
Generally factual but framed with mild liberal perspectives.
3. Center / Balanced / Neutral Journalism
Prioritizes objective, evidence-based news with minimal framing.
4. Lean Right Media
Covers:
- economic conservatism
- national security
- traditional values
5. Right-Wing / Conservative Media
Heavily opinion-driven with strong ideological stances.
How to Use a News Bias Chart Effectively
1. Diversify Your News Sources
The best way to avoid echo chambers is to compare coverage across left, center, and right outlets.
2. Identify Opinion vs. Straight News
Look for labels such as:
- “opinion”
- “analysis”
- “commentary”
Opinion pieces tend to use stronger ideological framing.
3. Use Fact-Checking Tools
Pair news bias charts with:
- media credibility checkers
- browser tools that flag bias
- misinformation tracking platforms
4. Compare Headlines
Biased outlets often use emotional or sensational wording to influence readers.
5. Evaluate Sources, Not Just Bias Scores
Bias doesn’t automatically mean poor quality — the key is journalistic accuracy.
Benefits of Using a News Bias Chart
✔ Encourages balanced news consumption
✔ Helps detect propaganda or misinformation
✔ Improves media literacy skills
✔ Builds critical thinking
✔ Promotes open-minded perspectives
Many educators, students, journalists, and researchers use bias charts to better understand the media landscape.
Examples of How People Use News Bias Charts
Education & Classrooms
Teachers use them to explain media literacy, propaganda techniques, and political polarization.
Research & Academic Writing
Students choose neutral or fact-reliable sources for essays and reports.
Business Decision-Making
Companies verify news before citing it in presentations or strategies.
Personal Bias Awareness
Readers use charts to expose their own news consumption habits.
Limitations of News Bias Charts
Even the best charts aren’t flawless. Challenges include:
- Some judgments remain subjective
- Political landscapes evolve constantly
- Not all outlets are assessed
- Charts can simplify complex journalism
Use them as tools — not absolute truth.
Best Tools and Alternatives to Explore
While tools vary worldwide, many offer:
- news credibility checks
- political bias indicators
- fact-checking databases
- media transparency reports
These help readers verify stories before sharing them.

Conclusion
A news bias chart is an essential tool in today’s polarized information world. It empowers readers to identify political leanings, assess journalistic quality, and make informed decisions about which outlets to trust.
If you want to strengthen your media literacy, explore more of our guides, read related articles, or contact us today for training, consulting, or personalized learning resources.
FAQs (People Also Ask)
1. What is the purpose of a news bias chart?
To help readers understand political bias and reliability levels of media outlets.
2. How accurate are news bias charts?
They are helpful, research-driven tools—but still involve expert judgment. Always cross-check content from multiple sources.
3. How can I tell if a news source is biased?
Look for emotional language, selective facts, one-sided narratives, and opinion-heavy articles.
4. What is the most unbiased news source?
No outlet is completely neutral, but several strive for balanced reporting. Checking multiple centrist outlets gives the most complete view.
5. How do news bias charts rank media outlets?
Through content analysis, fact-checking data, political spectrum evaluation, and expert scoring methods.
6. Why do people argue about media bias ratings?
Different political perspectives influence how individuals interpret news.